Support & Resistance
The first pattern is Support and Resistance. I group these together because they operate the same way in the chart. But, they are very different psychologically. Whenever you touch a support level for the third time, that usually indicates that you are going to bounce off and move to the upside. If you break through a support level that was formed with two prior points, that is usually a very powerful indication of a sell off. Support breaks can create panic and should therefore be shorted.
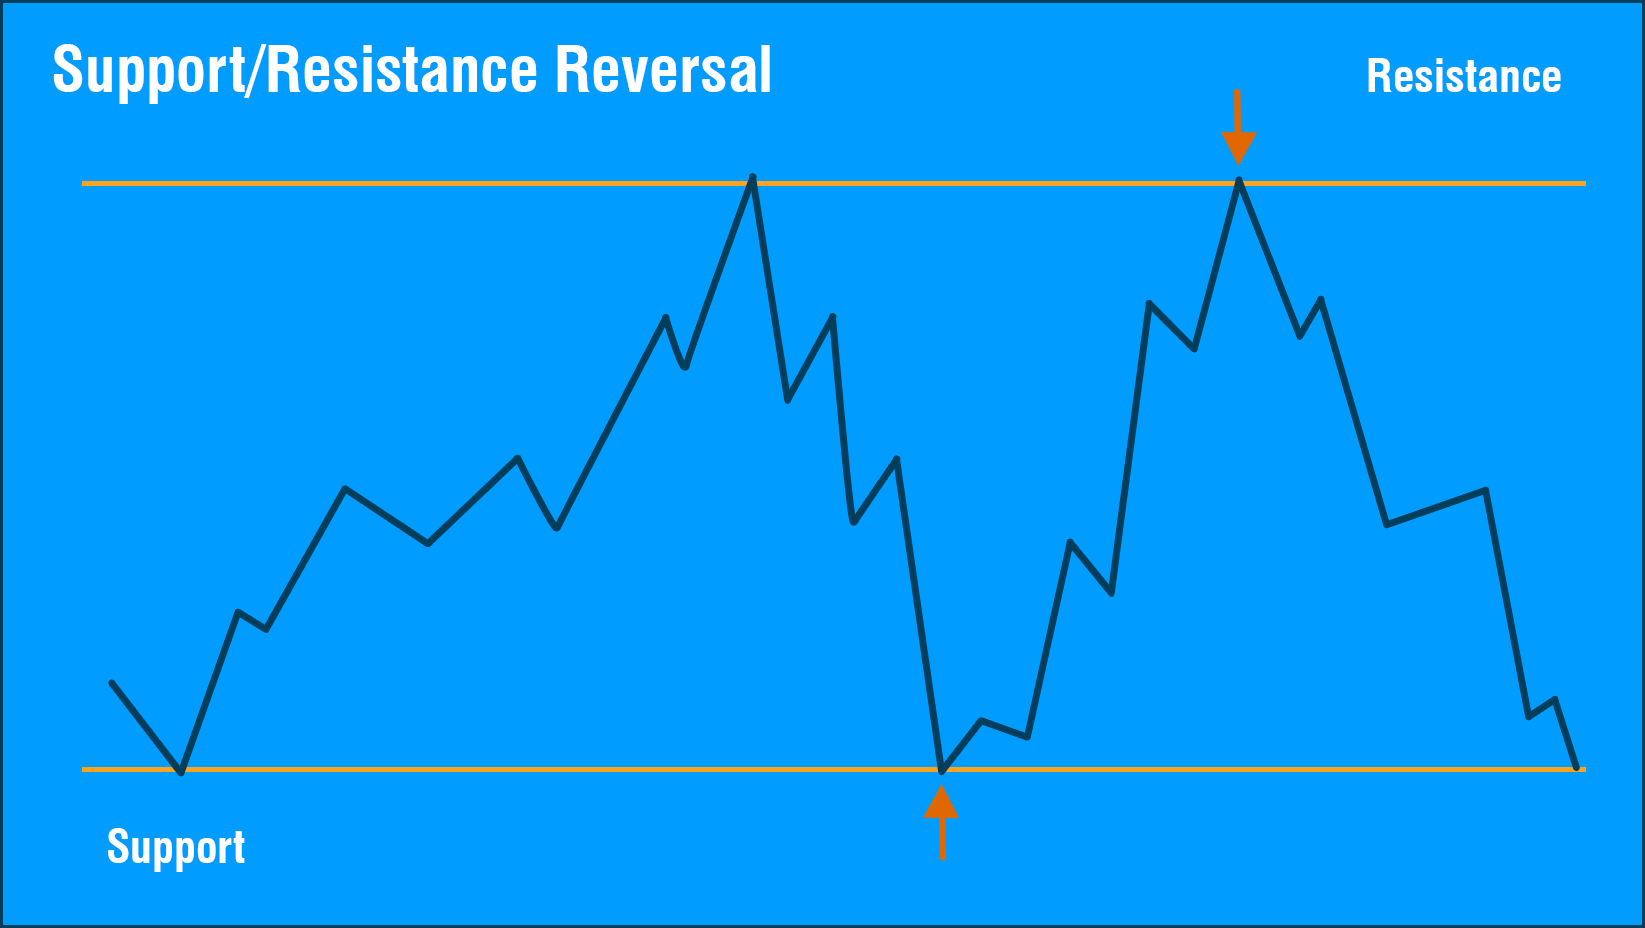
Resistance is equally powerful on the short side. If you approach a resistance line and reverse, the market will typically sell off at the reversal, and you will have a nice big drop that can be shorted. Conversely, if you break through a resistance level, as we saw in our first example, then the chart is most likely going to make a strong move in the positive direction.
Again, the reason this happens is because the market is watching that line. As price goes through the line, people pile on their buy orders because they think the stock is going higher. It is a self-fulfilling prophecy. All of these patterns work the same way. They are all based on the psychology of the market seeing the pattern and reacting to it, thereby accelerating the pattern formation.
Support & Resistance Reversal
Here is our expanded structure diagram for Support and Resistance. The reason we have two Eighths tools is that you can have a bounce or a break. The more powerful of the two is going to be a break. Support breaks do create panic, and you really want to watch for those. But, equally tradeable is a support bounce. Again, you are looking for the third bounce. Typically you will see where the chart bounced off a price level and now it is coming down for the third time. It is that third bounce that is typically the most tradeable. But, you can trade the second bounce as well.
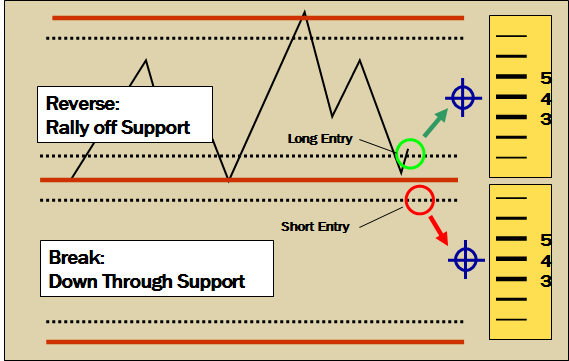
Looking at our structure, you can see that the target is drawn at the 50% level on both the upside and the downside, which gives us our 3:1 Reward:Risk from the ideal entry point.
Support & Resistance Bank of America
The first Support and Resistance example we will look at is Bank of America (BAC). If I look at the 2015 trading year you can see there is a zone around the $18 mark that could be penetrated. The market tried to rally Bank of America through it in July 2015 as it pushed right up to that $18 range and just could not hold above it. When it backs off for that third time and starts coming down to the $17 range, you know the market is going down from there with very high odds.
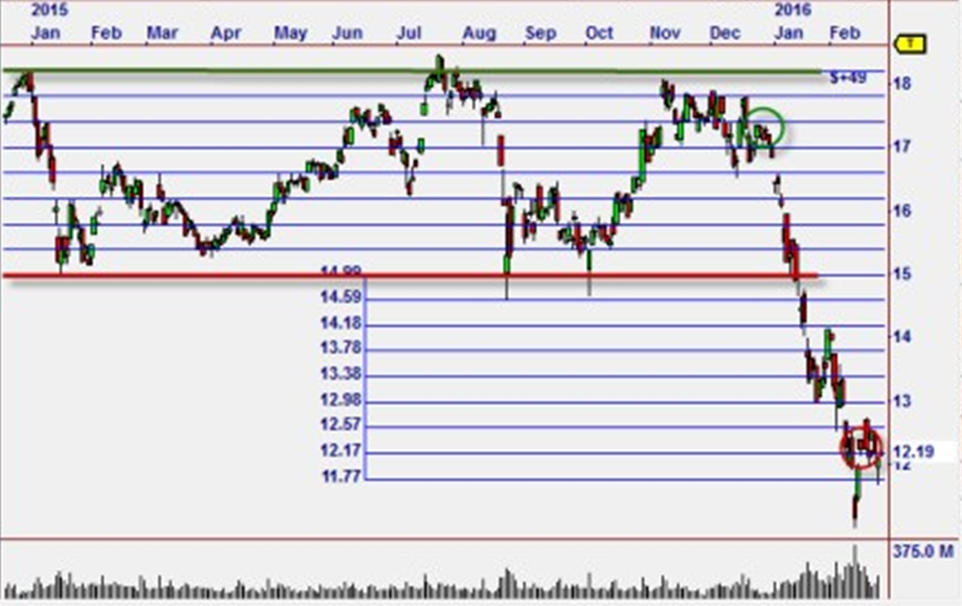
We just do not know how much it is going to move. We draw our Eights scale across the prior move. If I look on this chart -- this is very subjective -- I would say that relative to the size of the prior movement, that setting your Eights scale towards the lower support at $15 would be a good starting range. Remember that the placement of the Eights scale is not critical; However, it is better if you place one that is closer to the dimensionality of the chart.
Using the scale that I chose, from $18 to $15, you can follow the move all the way down from the hypothetical short trade at $17.40. You can see that I did not close below an Eights scale line and go back up across the prior to the end throughout our Eights scale. In cases like this I like to draw another Eights scale as an extension.
What the Eights tool is doing in this chart is it is keeping me in the trade through several places in the chart where it is bouncing up and down. Again, you have to look at where the price bars close. You have to wait for the close of the day and look at the closing price. If they close below the line, in this example because we are going short, then I move my stop down to the prior Eights scale line. If you look at the end of January into February, we did not close just below the $13 level so that is why we did not get taken out near the cross of the $13.75. The market did not close through there until we actually broke down and starting moving lower.
The Eights tool will keep you in trade much better than any other trailing stop. It does this because you are matching the stop values to the dimensionality of the chart.
Support & Resistance Delta
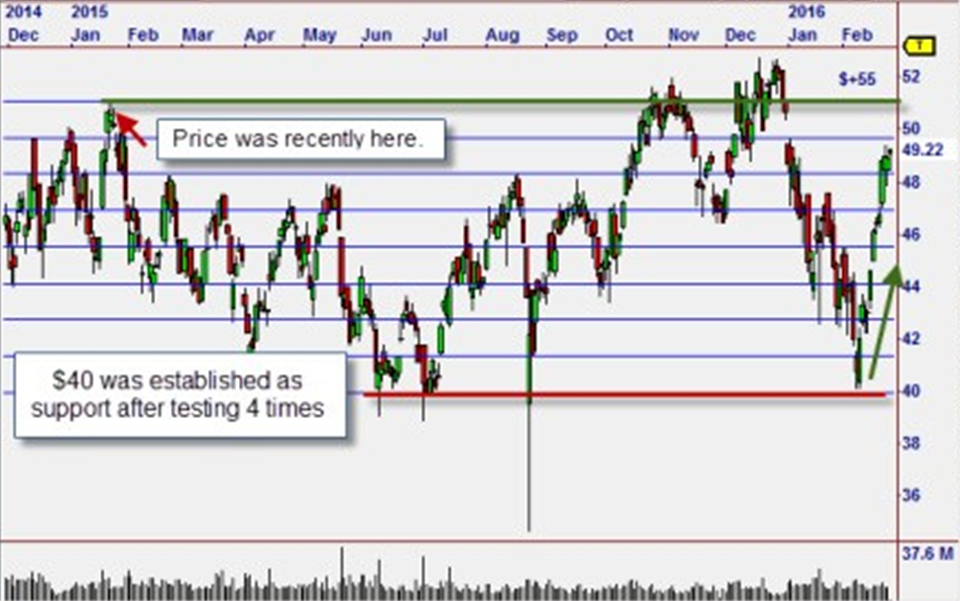
The second example is on Delta Airlines (DAL). There is a very clear support level at $40. I see four bounces. The third and fourth bounce were tradeable. If I had been using the Eighths tool off those points, I would have still been in the trade when it finally took off in February. If you just follow that Eighths scale all the way up you will see that it kept you in though the printing of this e-book.
Sometimes you will get stopped out just early of a big move as seen in September 2015 this will happen sometimes. You will rarely get the whole move. You will see that generally, the Eighths tool really does keep you in the trades for the longest possible time.
Support & Resistance Examples
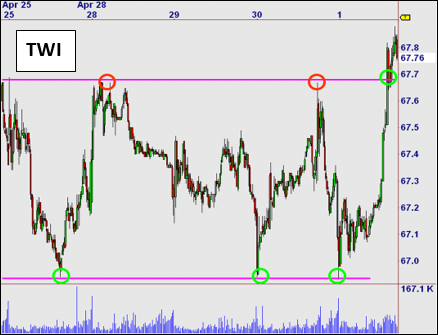
Titan Internet Inc. (TWI)
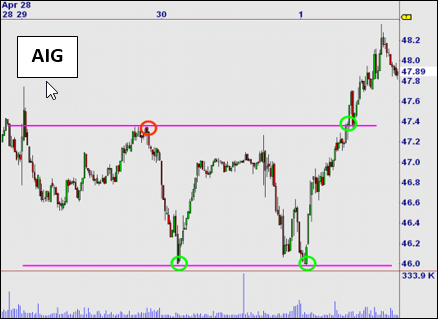
American International (AIG)
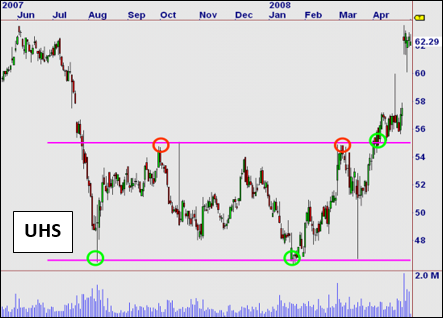
Universal Health Services (UHS)
WHAT IS FULGENT.AI?
The team at Fulgent has been applying Artificial Intelligence to the market with great success over the past 20 years. Using specific market measurements, security chart measurement, multiple time frame analysis and cross market correlation, Fulgent AI continually finds the best possible "setups" with unmatched accuracy and profitability - guaranteed to give you an edge, or your money back.

Call Us: 800-880-0338 Email Us: sales@fulgent.ai Fax Us: 512-345-4225
Following over 20 years of experience with A.I. the staff at Fulgent is now focused on ADAPTIVE Machine Learning, where computers learn to trade the markets in the same way human traders do.

Call Us: 800-880-0338
Email Us: sales@fulgent.ai
Fax Us: 512-345-4225
Following over 20 years of experience with A.I. the staff at Fulgent is now focused on ADAPTIVE Machine Learning, where computers learn to trade the markets in the same way human traders do.

